SPEL (Solution Pack for Experimental Laboratories) Kymograph is an isolated organs/tissue measuring, recording and analysis software, primarily designed for educational purposes.
The software provides highly accurate automatic and manual evaluation functions for isolated organs measurements, which are available both in online (measurement) and offline (analysis) mode.
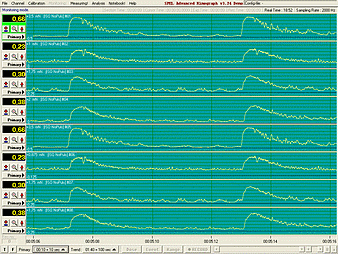 Main features:
- paralell acquiring, monitoring and recording up to 8 channels
- 8 charts for displaying channel-related derivated data and trends
- every action and event recorded into the notebook
- two different marker types displayed and recorded (Event or Range)
- automatic and manual analysis functions
- fast "on-the-fly" analysis option during recording
- basic off-line analysis
- measured and computed data collected into exportable data sheets
- several derivative values can be assigned to a primary channel
- High-Cut (HC) filter (for noise)
- automatic channel-layout
- multiplexable, redirectable physical channels (one physical channel can be attached to multiple logical channels)
After starting the software the main screen immediately displays 16 channels, which displays the incoming signals (Monitoring mode).
The channel display is divided into three main field:

- Primary signal display
- Trend display (pageable, behind the primary display)
- Service field
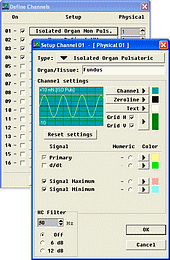 Type and characteristics of the channels can be set with the help of the Channel Definition pane.
From here can be open the Setup pane of the selected channel, on which the settings can be performed.
On the setup pane, the user can define, what type of haemodynamic signal will be measured and which parameters will be derived from the primary signal. Every color of the screen can be set, even the grid colors. The numeric value of the derivated signals can be selected for showing in a multimeter display. There is a low-pass and high-pass filter with selectable slope and finely adjustable cut-off frequency.
The system offers pre-defined types for the configuration.
These pre-defined types are:
- Isolated Organ Pulsatoric
- Isolated Organ Non-Pulsatoric
- Temperature
- User Defined (V, mV, uV, Hgmm, uA, pA, Unit)
Every pre-defined type offers individual derivative-list, from which can be select one or more parameter.
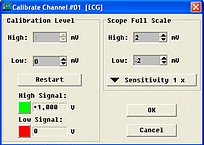 Software contains an easy-to-use two-point calibration procedure, which allows to get the most meticulous result. An inherent sensitivity setting is provided to measure easily different signal levels. In addition, the Calibration pane contains the scale-range setting option.
The settings and calibration can be save into setup files, so later can be open the desired file, and the previously performed settings become immediately active.
 If the system is already calibrated, the recording can be start.
At the start of the measuring, the system first asks for basic details of the experiment and then enters to measuring mode.
The recording has not yet starts at this moment, this will start with the Record button.
The experiment file can contain several recording session. It means, that during the experiment the recording can be stop and start several times.
During recording it is possible to place event- and range-markers in desired moments.
The marker-numbers (ID) are displaying on the time-bar. The detailed marker-informations can be reached through these IDs with one click.
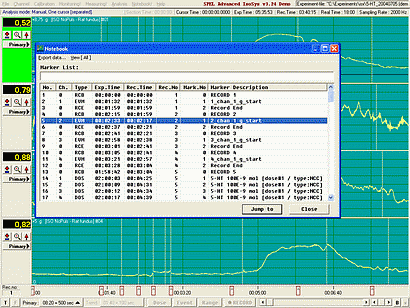 During the recording, the events are placed in a special notebook, in which the certain key positions later are directly available, and through this, it is possible for the primary and derivative curves rapid export as well.
Marker types are the followings:
- Record Begin
- Record End
- Dose
- Event
- Range Begin
- Range End
Notebook offers a quick marker-filter function, so the markers can be listed in type-based groups.
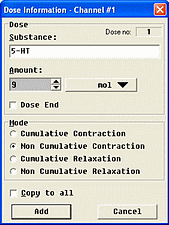 During Dose administration a specific marker is generated.
On Dose Information pane should be given the name and amount of the substance, and should be selected the experiment mode.
The software contains basic off-line analysis with the following functions:
- Manual analysis:
- One Cursor measurement
- Two Cursors measurement
- Automatikus analÝzisek:
- Integration (Absolute, Positive, Negative and Normal)
- Min-Max analysis (Periodic)
It is possible to export records, events and user-defined segments. The calculated data also exportable to CSV (ASCII) files, which can be imported to every third-party data-analysis software. Wide range of printing options are also available for the paper-based color or black/white displaying of the data tables and curves.
 Main features:
 Type and characteristics of the channels can be set with the help of the Channel Definition pane.
From here can be open the Setup pane of the selected channel, on which the settings can be performed.
On the setup pane, the user can define, what type of haemodynamic signal will be measured and which parameters will be derived from the primary signal. Every color of the screen can be set, even the grid colors. The numeric value of the derivated signals can be selected for showing in a multimeter display. There is a low-pass and high-pass filter with selectable slope and finely adjustable cut-off frequency.
The system offers pre-defined types for the configuration.
 Software contains an easy-to-use two-point calibration procedure, which allows to get the most meticulous result. An inherent sensitivity setting is provided to measure easily different signal levels. In addition, the Calibration pane contains the scale-range setting option.
The settings and calibration can be save into setup files, so later can be open the desired file, and the previously performed settings become immediately active.
 If the system is already calibrated, the recording can be start.
At the start of the measuring, the system first asks for basic details of the experiment and then enters to measuring mode.
The recording has not yet starts at this moment, this will start with the Record button.
The experiment file can contain several recording session. It means, that during the experiment the recording can be stop and start several times.
 During the recording, the events are placed in a special notebook, in which the certain key positions later are directly available, and through this, it is possible for the primary and derivative curves rapid export as well.
 During Dose administration a specific marker is generated.