Ergostress TB-02 * Cardiovascular analyzing system for exercise tests

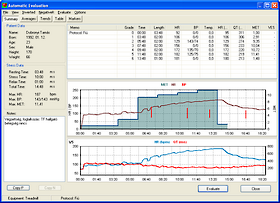
Ergostress TB-02 system provides stable and reliable follow-up of physiological changes proportional to the exercise done on bicycle ergometer or treadmill.

Main features:
The software is working with ergometry devices produced by Ergo-Fit GmbH and Woodway Inc. and, based on the requirements and possibilities of the user and the examination facility, the measuring devices can be operated either with bicycle or treadmill. Thanks to telemetric design the measuring setup can be placed anywhere within the examination facility, and need not be placed directly next to the exercise device. The system provides wide range of application possibilities among others in the everyday practice of cardiologic diagnostics, in sports medicine, and in rehabilitation follow-up.

Patient management and measurement notes

The patient manager panel is quickly available via the shortcut icon. Here, data of a new patient can be registered, or previously registered patients can be chosen.

The identification code is generated automatically by the software for each patient. Besides recording of personal data, further documentation (recording weight and height, creating patient groups, export/import of data, recording all information about the patient and the examination), and reloading of the previously saved primary curves can be carried out here. At archiving personal data of the patients, protection of personal data was considered.

Besides recording patient data, important details of individual measurements can be recorded and stored into a separate data table.

Measurement protocols

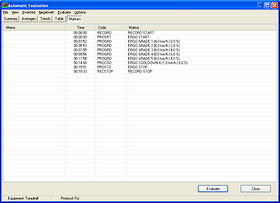
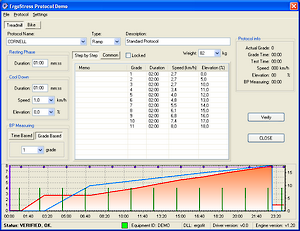
The software contains the standard protocols used in exercise tests (e. g. Cooper, Bruce) which can be immediately loaded and used. Furthermore, we provide opportunity for the user to create new protocols by modifying the existing ones or by programming and applying independent protocols, used and approved before at the examination facility.

In the panel, the user can set the resting phase before measurement (setting the time), exercise phase (setting the speed and angle of inclination, or load wattage) and cooldown after exercise (setting exercise load and time) can be set in the panel.

Moreover, frequency (based on time or load level) of automatic measurements by the connected blood pressure measuring device can be set, but the user can start a measurement at any time during the examination, which is equivalent to the programmed ones and the result of which will be also stored.

Protocols created by the user can be saved into the data base of the system and reloaded at any time, for an unlimited number of measurements.

Monitoring and recording

ECG curves of the patient in up to 12 channels, temperature measured continuously, blood pressure values (measured according to a pre-defined schedule or manually), trend(s) chosen by the user, and the continuously updated superimposed curve, compared to the resting phase, are displayed during the measurement on one or two monitors. Trends can be displayed one-by-one or in pairs defined by the user.

  • ST Slope (mV/s)
  • P (mV)
  • Q (mV)
  • R (mV)
  • T (mV)
  • ST (mV)
  • RR (ms)
  • HR (bpm)
  • P range (ms)
  • PP (ms)
  • ST segment (ms)
  • ST interval (ms)
  • PR (ms)
  • QRS (ms)
  • QT (ms)
  • QTcb (ms)
  • T-Te (ms)


Offline automatic ECG analysis

After the test, offline analysis sheets included in the software can be completed quickly. For this, previous recording has to be reloaded, then basic conditions (e. g. speed, amplification, trigger level, filters) required for the analysis and optional parameters of the analysis sheets (e. g. which leads should the software use for ECG averaging or which trends should the software calculate and show.) have to be defined.

After the setup, the software evaluates the record and creates the following analysis sheets:


Summarizing analysis sheet

Averaged ECG analysis sheet

Trend analysis sheet


Value analysis sheet

Marker sheet
After the automatic offline analysis, data sheets can be printed out separately or together as pre-defined, clear medical records. For a given examination, offline automatic analyses are freely repeatable, thus can be run again and printed out even with altered parameters (e. g. choosing other trends).

Offline manual ECG analysis

The primary curves saved immediately after examination, or any of the previously archived ones, can be reloaded and re-evaluated. For the evaluation, the program gives six ways which are accessible via the Analysis menu. During analysis, the system automatically calculates the characteristic parameters from a certain part of the ECG chosen by the user. The calculated parameters are recorded in a table automatically and can be printed out or exported.


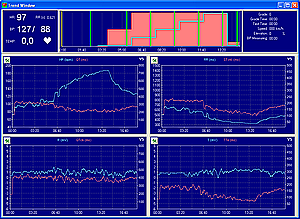
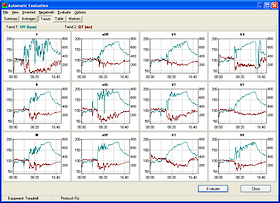
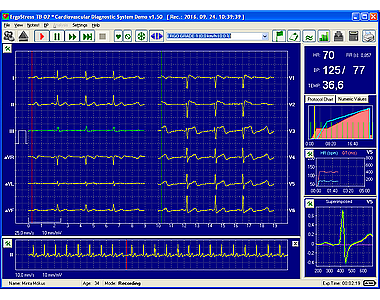
ECG QT and QT variability evaluation

QT dispersion determination from 12 leads.


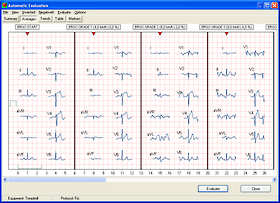
Cycle-based and Averaged ECG analysis
with automatic evaluation.

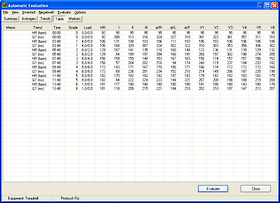
HRV (heart rate variability) determination
by time- and frequency range analysis.